@haikaladitt: #fyp #fyppppppppppppppppppppppp #propermio #xyzbca

Iteksss
Iteksss
Open In TikTok:
Region: ID
Saturday 14 September 2024 14:52:26 GMT
333145
36640
188
856

Music

Download

Comments

ekasa3a
🥷 :
tapi kebanyakan kalo bocil bilangnya "Mio Mirza"🗿
2024-09-14 18:48:13
309
apisssz_4
apis gwanteng bwgt ancrwit :
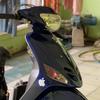
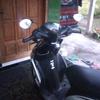
ini motor Mio smile atau Mio apa punten numpang nanya🙏
2024-09-15 10:30:37
16
syikaa86
RL SYIKAA :
ak mio sportyy
2024-11-10 13:01:05
0
peyudd_sajah
Saya Peyudddd? :
kemarin Mio gw di tawar 3,5jt😭
2024-09-14 22:54:45
52
afiliatormudaa
V-FYP? :
1jt lepas sini a🥰
2024-09-15 00:10:11
6
keiikzshi
sévenzy, keiidetta :
ya karna ga mungkin main mio ga main mesin🤣
2024-09-14 16:27:10
0
bang_rizzz01
Muhammad Rizki :
a mau tanya ,beda nya sporty ama Thailand ap a
2024-09-15 01:30:36
3
hanifwic
무미즈 :
Asli ketemu bocil disuruh geber pdhl mio brisik bgt, senengnya bocil ngerti motor😂
2024-09-15 00:18:46
27
j4s0nnnn
nicho :
info striping
2024-10-06 12:21:02
0
bvvx22_
b :
seharus nya kalo bapak' "3 juta lepas ga dek?"
2024-09-16 07:23:38
20
sptie.e
spty.parker :
brandaku isine mio proper kabeh sedangkan mio ku soul😭😭
2024-09-28 05:57:28
0
bayu51229
bayu :
otw main mio vario taro Dulu Dikamar 😁
2024-09-16 03:02:16
1
ownersky26
dhavina_indria :
gue:wihh mio😋
2024-09-15 00:18:53
8
zxdimz_
dms aja :
seru emg banyak kejutan😝
2024-09-15 01:51:16
3
payaddzz.neww
BISMILLAH :
kadang tertinggi kadang juga terrrendahh 😆😆🔥
2024-09-14 23:55:32
2
yaaa_arrr
𝙢𝙪𝙠𝙛𝙚𝙧𝙨.𝗶𝗱⚡ :
serunya main mio : beda orang beda pertanyaan 🗿
2024-10-12 04:24:07
1
alip3486
🅰️Lippp :
ga gila bang main mio🗿
2024-09-14 23:35:17
1
cv.pertamina27_official
CV.pertamina27 :
awal mula nanya tahun lalu nawar dengan harga 3jt mau heran tapi itu bapak² random
2024-09-15 00:49:46
1
aditrmdan7
adit🦆💨 :
mio gw udah lakuu bang🗿
2024-09-15 05:28:52
0
opikurosky
opikurosky :
Rill🔥🔥🔥
2024-09-17 10:39:07
0
darknesss865
darkness_4 :
gw beat fi limit 100 , di salip mio ga kekejar sama gw anj spek apaa tu 😅
2024-11-09 03:07:48
0
rstuankkbaik
rstecuuu🌀 :
Moonlight red aa?
2024-09-15 11:17:34
0
aku_empi
Elaina :
mio akaza
2024-12-01 09:38:28
0
nofalhttps
N4fL :
di tawar bapak2 3.5 di lampu merah
2024-09-15 10:05:52
0
ajus27413
ajus :
cuma
2024-12-02 04:05:14
0
To see more videos from user @haikaladitt, please go to the Tikwm homepage.

Other Videos

Market Structure Explained | Time Frame Analysis | Chart Patterns | Trend Trading  Comprehensive Guide to Technical Analysis Concepts 1. Candlestick Patterns Names Candlestick patterns are essential for predicting price movements based on past price action. They can be bullish (indicating potential upward movement) or bearish (indicating potential downward movement). Common Single Candlestick Patterns: - Doji (Indecision) - Hammer (Bullish reversal)   - Hanging Man (Bearish reversal) - Shooting Star (Bearish reversal) - Inverted Hammer (Potential bullish reversal) Common Multi-Candlestick Patterns: - Engulfing Patterns (Bullish & Bearish) - Harami Patterns (Bullish & Bearish) - Morning Star (Bullish reversal)   - Evening Star (Bearish reversal)   - Three White Soldiers (Strong bullish trend) - Three Black Crows (Strong bearish trend) 2. Time Frame Analysis Different time frames help traders identify short-term, medium-term, and long-term trends. Common Time Frames: - Short-Term (Intraday Trading):   - 1-minute (1M)   - 5-minute (5M)   - 15-minute (15M)   - 1-hour (1H) - Medium-Term (Swing Trading):    - 4-hour (4H)   - Daily (1D) - Long-Term (Position Trading/Investing):   - Weekly (1W)   - Monthly (1M) Multi-Time Frame Analysis (MTFA): - Use a higher time frame (e.g., daily) for trend direction. - Use a lower time frame (e.g., 1H) for entry timing. 3. Support and Resistance Support and resistance levels indicate where price may pause or reverse. Key Concepts: - Support: Price level where buying interest is strong enough to prevent further decline. - Resistance: Price level where selling pressure is strong enough to prevent further rise. - Breakout.  When price moves beyond support/resistance with momentum. - Retest: Price revisits a broken level to confirm its new role (support becomes resistance & vice versa). Types of Support & Resistance: - Static (Horizontal):.Fixed price levels. - Dynamic (Trendlines, Moving Averages): Adjusts over time. - Psychological Levels: Round numbers (e.g., $100, $1.50). 4. Trend Types Identifying trends helps traders align with market momentum. Three Types of Trends: 1. Uptrend (Bullish Trend):  - Higher highs (HH) & higher lows (HL).  - Traders look for buying opportunities. 2. Downtrend (Bearish Trend):  - Lower highs (LH) & lower lows (LL).  - Traders look for selling opportunities. 3. Sideways (Range-bound Market):  - Price moves between support & resistance without a clear trend. - Traders use range strategies (buy low, sell high). Trend Strength Indicators: - Moving Averages (e.g., 50MA, 200MA) - ADX (Average Directional Index) 5. Chart Patterns Names Chart patterns help predict future price movements based on historical formations. Reversal Patterns (Indicate Trend Change): - Head & Shoulders (H&S) (Bearish reversal) - Inverse Head & Shoulders (Bullish reversal) - Double Top (Bearish reversal)   - Double Bottom - Candlestick patterns trading   - Best time frame for day trading   - How to draw support and resistance   - Trend analysis forex/stock market   - Bullish chart patterns   - Market structure trading strategy   - Price action trading   - Technical analysis for beginners   - Swing trading strategies   - Breakout trading tips   #StockMarket #TradingTips #ForexTrading #Investing #DayTrading   #TechnicalAnalysis #CandlestickPatterns #SupportResistance   #SwingTrading #TrendTrading #ChartPatterns #PriceAction   #FinancialFreedom #LearnTrading #TradingEducation #MarketAnalysis   #StocksToWatch #CryptoTrading #TradingStrategies #ForexSignals   #TradeSmart #TradingForBeginners #StockMarketTips #InvestSmart   #FinancialMarkets #TradingPsychology #RiskManagement #TradeLikeAPro   #Bullish #Bearish #markettrends
Market Structure Explained | Time Frame Analysis | Chart Patterns | Trend Trading Comprehensive Guide to Technical Analysis Concepts 1. Candlestick Patterns Names Candlestick patterns are essential for predicting price movements based on past price action. They can be bullish (indicating potential upward movement) or bearish (indicating potential downward movement). Common Single Candlestick Patterns: - Doji (Indecision) - Hammer (Bullish reversal) - Hanging Man (Bearish reversal) - Shooting Star (Bearish reversal) - Inverted Hammer (Potential bullish reversal) Common Multi-Candlestick Patterns: - Engulfing Patterns (Bullish & Bearish) - Harami Patterns (Bullish & Bearish) - Morning Star (Bullish reversal) - Evening Star (Bearish reversal) - Three White Soldiers (Strong bullish trend) - Three Black Crows (Strong bearish trend) 2. Time Frame Analysis Different time frames help traders identify short-term, medium-term, and long-term trends. Common Time Frames: - Short-Term (Intraday Trading): - 1-minute (1M) - 5-minute (5M) - 15-minute (15M) - 1-hour (1H) - Medium-Term (Swing Trading): - 4-hour (4H) - Daily (1D) - Long-Term (Position Trading/Investing): - Weekly (1W) - Monthly (1M) Multi-Time Frame Analysis (MTFA): - Use a higher time frame (e.g., daily) for trend direction. - Use a lower time frame (e.g., 1H) for entry timing. 3. Support and Resistance Support and resistance levels indicate where price may pause or reverse. Key Concepts: - Support: Price level where buying interest is strong enough to prevent further decline. - Resistance: Price level where selling pressure is strong enough to prevent further rise. - Breakout. When price moves beyond support/resistance with momentum. - Retest: Price revisits a broken level to confirm its new role (support becomes resistance & vice versa). Types of Support & Resistance: - Static (Horizontal):.Fixed price levels. - Dynamic (Trendlines, Moving Averages): Adjusts over time. - Psychological Levels: Round numbers (e.g., $100, $1.50). 4. Trend Types Identifying trends helps traders align with market momentum. Three Types of Trends: 1. Uptrend (Bullish Trend): - Higher highs (HH) & higher lows (HL). - Traders look for buying opportunities. 2. Downtrend (Bearish Trend): - Lower highs (LH) & lower lows (LL). - Traders look for selling opportunities. 3. Sideways (Range-bound Market): - Price moves between support & resistance without a clear trend. - Traders use range strategies (buy low, sell high). Trend Strength Indicators: - Moving Averages (e.g., 50MA, 200MA) - ADX (Average Directional Index) 5. Chart Patterns Names Chart patterns help predict future price movements based on historical formations. Reversal Patterns (Indicate Trend Change): - Head & Shoulders (H&S) (Bearish reversal) - Inverse Head & Shoulders (Bullish reversal) - Double Top (Bearish reversal) - Double Bottom - Candlestick patterns trading - Best time frame for day trading - How to draw support and resistance - Trend analysis forex/stock market - Bullish chart patterns - Market structure trading strategy - Price action trading - Technical analysis for beginners - Swing trading strategies - Breakout trading tips #StockMarket #TradingTips #ForexTrading #Investing #DayTrading #TechnicalAnalysis #CandlestickPatterns #SupportResistance #SwingTrading #TrendTrading #ChartPatterns #PriceAction #FinancialFreedom #LearnTrading #TradingEducation #MarketAnalysis #StocksToWatch #CryptoTrading #TradingStrategies #ForexSignals #TradeSmart #TradingForBeginners #StockMarketTips #InvestSmart #FinancialMarkets #TradingPsychology #RiskManagement #TradeLikeAPro #Bullish #Bearish #markettrends

About