@hao.nguyen1904: Hai cây chiến đất nhà 😁@🥰 cậu 🥰 út 🥰 sóc 🥰trăng @Thành Hiếų @🥰CẬU🥰HAI🥰 SÓC 🥰TRĂNG🥰 #xuhuongtiktok #dc70plus #xuhuong

Hào sữa 🔥🌾
Hào sữa 🔥🌾
Open In TikTok:
Region: VN
Sunday 18 January 2026 06:34:06 GMT
189867
2096
27
53

Music

Download

Comments

trvantai118
TrVanTai🤍 :
cây 70 kia để hàm 95 đc gòi để hàm 105 nặng quá
2026-01-18 10:52:04
0
quocthang162
Fb:Quốc.Thắng✈️✈️🚜 :
chạy quá chạy r😝
2026-01-18 13:46:21
2
thanhhieu67b2
Thành Hiếų 🐷 :
lên xh dễ v
2026-01-19 01:28:19
0
lm.luu3
nhincc :
chí vọng đâu a
2026-01-18 10:11:43
0
nhiduongmuong
🥰 cậu 🥰 út 🥰 sóc 🥰trăng :
có ai thích thể hiện không bá vô
2026-01-18 06:37:44
0
h4rman7819
Dari kontak :
speed🔥
2026-03-16 13:04:06
1
_duytan2310
𝐌𝐚𝐢 𝐃𝐮𝐲 𝐓â𝐧 ❤️🎋 :
máy này bay chứ hết chạy gòi 😅
2026-01-18 14:10:08
0

trinh_22_09
Lànhᥫᩣ :
🥰🥰🥰
2026-01-18 13:17:34
1
minh.bang97
BĂNG HANH :
🥰🥰
2026-01-18 10:58:51
1
nhuhuynh201123
H Nhu :
🥰
2026-06-09 00:25:25
1
v.ti.sc.trng
Quê Tôi sóc Trăng ngã 5 :
🥰🥰🥰🥰🥰
2026-01-19 03:41:57
1
ce58482541
Ph Chi Nhut🌊 :
vip quá ah ơi
2026-01-22 12:28:08
1

tn60542
Tấn :
🥰🥰🥰
2026-01-24 15:43:24
1
tin.s510
tiến sĩ :
hay lắm
2026-03-01 21:47:10
1
To see more videos from user @hao.nguyen1904, please go to the Tikwm homepage.
Other Videos

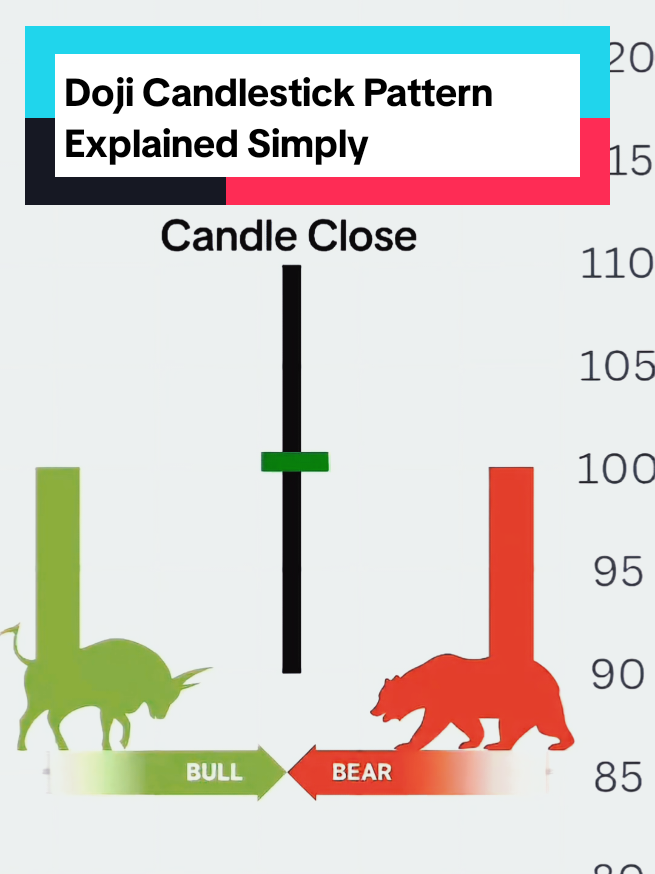
Doji Candlestick Pattern Explained Simply  How to Trade Doji Patterns Like a Pro What is a Doji Candlestick Pattern? A Doji candlestick forms when a security's opening and closing prices are nearly equal, creating a candle that looks like a cross or plus sign. This indicates market indecision—neither buyers nor sellers are in full control. 🔹 Key Characteristics of a Doji: Small or no real body Long upper and/or lower shadows Signals potential reversal or consolidation Must be analyzed with context (trend, volume, support/resistance) 🔸 Types of Doji Candlestick Patterns: 1. Standard Doji Opens and closes at the same price Sign of indecision or pause Needs confirmation 2. Long-Legged Doji Long upper and lower wicks High volatility during session Indicates uncertainty and possible reversal 3. Dragonfly Doji Long lower shadow, no upper shadow Price rejected lower prices and closed near high Often bullish reversal at the bottom of a downtrend 4. Gravestone Doji Long upper shadow, no lower shadow Price rejected higher prices and closed near the low Often bearish reversal at the top of an uptrend 5. Four Price Doji Open, High, Low, Close are the same Extremely rare Complete indecision in market ✅ How to Trade Doji Candlestick Patterns: 🔹 1. Identify the Market Context Trend direction: A Doji in an uptrend may signal bearish reversal; in a downtrend, a bullish reversal. Look for it near support/resistance levels or supply/demand zones. 🔹 2. Wait for Confirmation Don’t trade the Doji alone. Use the next candlestick to confirm the direction: Bullish confirmation: strong bullish candle after a Doji Bearish confirmation: strong bearish candle after a Doji 🔹 3. Use Indicators for Support RSI (Overbought/Oversold) MACD crossover Volume analysis to validate reversal 🔹 4. Set Entry & Exit Points Entry: After confirmation candle closes Stop-loss: Below Doji’s low (for long), above Doji’s high (for short) Take-profit: Use next resistance/support or 1:2 risk/reward 📌 Example Trade (Bullish Reversal): 1. Downtrend + Dragonfly Doji forms at support 2. Next candle is bullish → confirmation 3. Enter long at candle close 4. Stop-loss below Doji’s low 5. Target recent resistance or risk-reward level ⚠️ Tips: Doji is more powerful on higher timeframes (1H, 4H, Daily) Combine with other patterns (e.g., double bottom, engulfing) Avoid trading Doji in sideways/choppy markets Doji candlestick pattern How to trade Doji candle Dragonfly Doji Gravestone Doji Candlestick chart patterns Reversal candlestick Doji confirmation strategy Price action trading Forex candlestick patterns Beginner trading strategy Bullish Doji pattern Bearish Doji candle Trading psychology Candle pattern explanation Market structure with Doji #DojiCandlestick #ForexTrading #PriceAction #TradingStrategy #CandlestickPatterns #TechnicalAnalysis #ChartPatterns #SmartMoneyConcepts #DojiPattern #ReversalPattern #BullishReversal #BearishReversal #DragonflyDoji #GravestoneDoji #TradingTips #ForexEducation #DayTrading #SwingTrading #StockMarketTips #ForexForBeginners #TradingSetup #ChartAnalysis #LearnTrading #CryptoTrading #MarketReversal #CandlestickAnalysis #TradeSmart #ForexPriceAction #ForexChartPatterns #DojiCandleStrategy #tradingmindset
Doji Candlestick Pattern Explained Simply How to Trade Doji Patterns Like a Pro What is a Doji Candlestick Pattern? A Doji candlestick forms when a security's opening and closing prices are nearly equal, creating a candle that looks like a cross or plus sign. This indicates market indecision—neither buyers nor sellers are in full control. 🔹 Key Characteristics of a Doji: Small or no real body Long upper and/or lower shadows Signals potential reversal or consolidation Must be analyzed with context (trend, volume, support/resistance) 🔸 Types of Doji Candlestick Patterns: 1. Standard Doji Opens and closes at the same price Sign of indecision or pause Needs confirmation 2. Long-Legged Doji Long upper and lower wicks High volatility during session Indicates uncertainty and possible reversal 3. Dragonfly Doji Long lower shadow, no upper shadow Price rejected lower prices and closed near high Often bullish reversal at the bottom of a downtrend 4. Gravestone Doji Long upper shadow, no lower shadow Price rejected higher prices and closed near the low Often bearish reversal at the top of an uptrend 5. Four Price Doji Open, High, Low, Close are the same Extremely rare Complete indecision in market ✅ How to Trade Doji Candlestick Patterns: 🔹 1. Identify the Market Context Trend direction: A Doji in an uptrend may signal bearish reversal; in a downtrend, a bullish reversal. Look for it near support/resistance levels or supply/demand zones. 🔹 2. Wait for Confirmation Don’t trade the Doji alone. Use the next candlestick to confirm the direction: Bullish confirmation: strong bullish candle after a Doji Bearish confirmation: strong bearish candle after a Doji 🔹 3. Use Indicators for Support RSI (Overbought/Oversold) MACD crossover Volume analysis to validate reversal 🔹 4. Set Entry & Exit Points Entry: After confirmation candle closes Stop-loss: Below Doji’s low (for long), above Doji’s high (for short) Take-profit: Use next resistance/support or 1:2 risk/reward 📌 Example Trade (Bullish Reversal): 1. Downtrend + Dragonfly Doji forms at support 2. Next candle is bullish → confirmation 3. Enter long at candle close 4. Stop-loss below Doji’s low 5. Target recent resistance or risk-reward level ⚠️ Tips: Doji is more powerful on higher timeframes (1H, 4H, Daily) Combine with other patterns (e.g., double bottom, engulfing) Avoid trading Doji in sideways/choppy markets Doji candlestick pattern How to trade Doji candle Dragonfly Doji Gravestone Doji Candlestick chart patterns Reversal candlestick Doji confirmation strategy Price action trading Forex candlestick patterns Beginner trading strategy Bullish Doji pattern Bearish Doji candle Trading psychology Candle pattern explanation Market structure with Doji #DojiCandlestick #ForexTrading #PriceAction #TradingStrategy #CandlestickPatterns #TechnicalAnalysis #ChartPatterns #SmartMoneyConcepts #DojiPattern #ReversalPattern #BullishReversal #BearishReversal #DragonflyDoji #GravestoneDoji #TradingTips #ForexEducation #DayTrading #SwingTrading #StockMarketTips #ForexForBeginners #TradingSetup #ChartAnalysis #LearnTrading #CryptoTrading #MarketReversal #CandlestickAnalysis #TradeSmart #ForexPriceAction #ForexChartPatterns #DojiCandleStrategy #tradingmindset

About